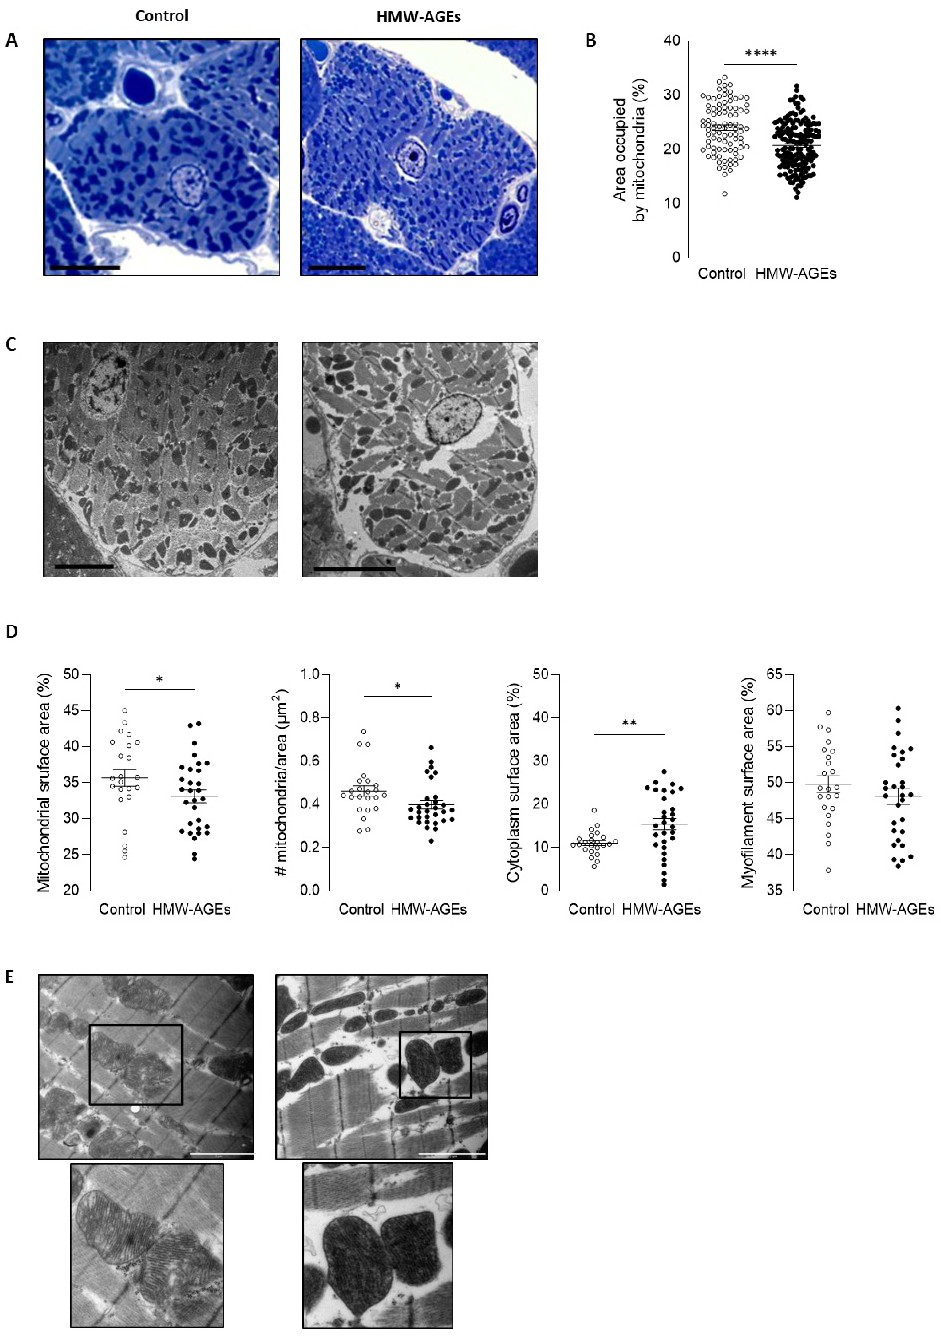
Fig. 5. Morphometric analysis of cardiomyocyte organization reveals alterations with HMW-AGEs injections. (A) Toluidine blue-staining of LV cardiomyocytes from control (left panel) and HMW-AGEs (right panel) animals showing mitochondria (dark blue) and myofilaments/cytoplasm (light blue). (B) Quantification of mitochondrial surface area in cardiomyocytes from control (ncells=90) and HMW-AGEs (ncells=165) animals via thresholding. Mitochondrial surface area is expressed as a percentage of total cell area (p<0.0001, parametric unpaired t-test). (C) Representative electron micrographs of LV cardiomyocytes. Cardiomyocytes showed typical intracellular organization of myofilaments (light grey), mitochondria (dark grey) and cytoplasm (white). Magnification: 1800×. Scale bars: 5 µm. (D) Quantification of mitochondrial surface area, mitochondrial density, cytoplasm and myofilament surface area. Mitochondrial surface area in cardiomyocytes from control (ncells=23) and HMW-AGEs (ncells=30) animals (p=0.0471, parametric unpaired t-test). Intracellular fractions are expressed as a percentage of total grid points. Mitochondrial density calculated as the ratio of mitochondrial number to total cell area (p=0.0197, parametric unpaired t-test). Quantification of cytoplasm (p=0.0020, parametric unpaired t-test) and myofilament surface (p=0.1490, parametric unpaired t-test) areas in cardiomyocytes from control (ncells=23) and HMW-AGEs (ncells=30) animals. (E) Representative electron micrographs of the mitochondria in LV cardiomyocytes. Lower panels, enlargement of the marked area. Magnification: 14000×. Scale bars: 2 µm. Data are presented as mean ± SEM. * denotes p<0.05, ** denotes p<0.01 and ****denotes p<0.0001.